

.svg)
How to Measure Content Marketing ROI (A Practical Guide) | ClusterMagic

Most content teams can tell you how many page views they got last month. Very few can tell you how much revenue those page views generated. That gap is the core problem with content marketing ROI: the tools to create and publish content are everywhere, but the systems to measure its financial impact are rare.
Only 21% of marketers say they can accurately measure content ROI, according to recent industry data. That's not a content quality problem. It's a measurement infrastructure problem. This guide gives you the formulas, metrics, and frameworks to close that gap and speak the language your leadership actually cares about. If you want to see how a structured content program tracks and reports these numbers in practice, get started with ClusterMagic.
Why Content Marketing ROI Is Hard to Measure
Content doesn't convert in a straight line. A potential customer might read a blog post in January, download a comparison guide in March, and then book a demo in May after seeing a retargeted ad. Last-touch attribution credits the ad. The blog post that started the whole journey gets nothing.
Multi-touch attribution exists precisely to solve this problem, but most teams don't have it set up. The result: content looks like a cost center on the spreadsheet, even when it's quietly driving half the pipeline.
Before you can measure content ROI accurately, you need to understand which part of the journey you're measuring. Are you measuring direct revenue from content? Influenced pipeline? Organic traffic value as a cost-savings proxy? Each of these is legitimate, and most mature content programs track all three. If you are still building the strategy that underpins your measurement, the blog content strategy guide is worth reading before you set up your tracking infrastructure.
The Content Marketing ROI Formula
The base formula is straightforward:
Content ROI = (Value Generated - Cost of Content) / Cost of Content x 100
If you spent $10,000 producing and distributing content and that content generated $50,000 in attributed revenue, your ROI is 400%.
A 5:1 ratio (500% ROI) is generally considered strong for content marketing. Anything below 2:1 (200%) suggests your costs are too high or your attribution is capturing too little value.
What Goes Into "Cost of Content"
Most teams undercount costs. A complete picture includes:
- Writer/editor salaries or freelancer fees
- Design and visual production
- Content management system and publishing tools
- SEO and analytics software
- Distribution costs (email, promotion, paid amplification)
- Internal team time for strategy, review, and project management
If your content operation runs $15,000/month all-in, that's the denominator you use.
What Goes Into "Value Generated"
This is where most teams stop short. Value has multiple components:
- Direct revenue: Deals where the buyer's first or primary touchpoint was a piece of content
- Pipeline influence: Deals where the prospect consumed content before converting, even if content wasn't the last touch
- Organic traffic value: The estimated cost you would have paid in Google Ads to get the same clicks (use your average CPC multiplied by monthly organic clicks)
- Brand lift: Increases in direct and branded search traffic, which signal growing awareness
For most teams starting out, tracking direct conversions and organic traffic value together gives a credible, defensible picture of ROI without needing a full CRM attribution model on day one.
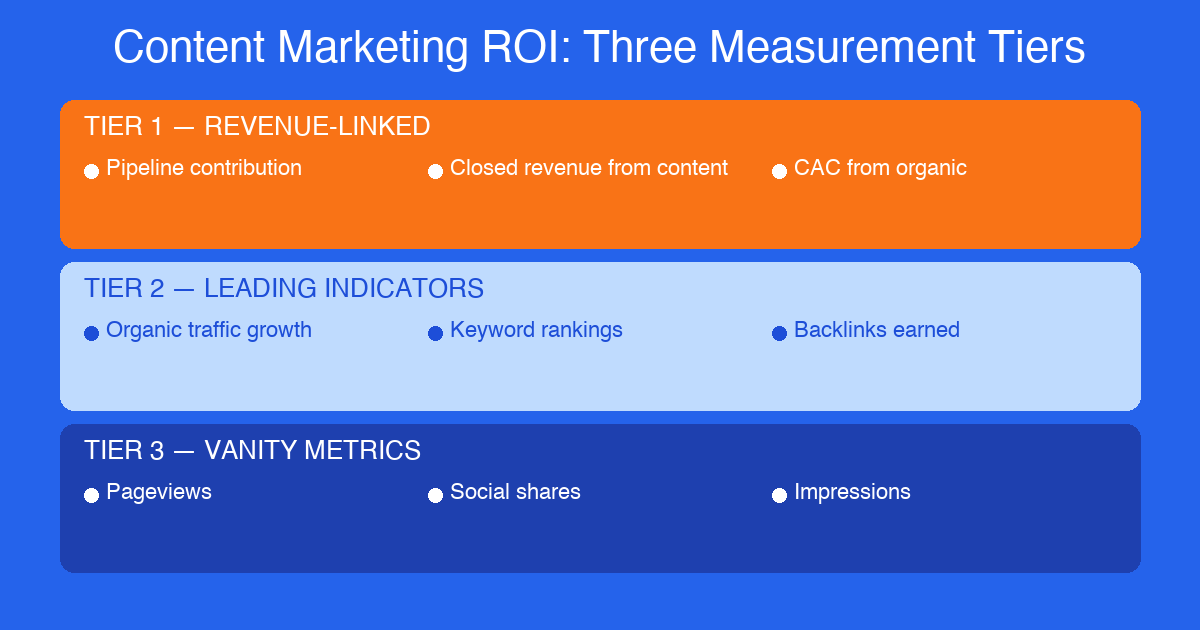
Content Marketing Metrics That Actually Matter
Tier 1: Revenue-Linked Metrics
These are the metrics that move stakeholder conversations from "interesting" to "strategic asset." Prioritize these in any executive report.
Marketing-qualified leads (MQLs) from organic measures how many leads your content generates through search, not just how many people read it. Track this by source in Google Analytics or your CRM.
Content-influenced pipeline is the total deal value where a prospect engaged with at least one piece of content before becoming an opportunity. This number lives in your CRM (tools like HubSpot and Salesforce can surface it with proper UTM tracking and campaign attribution set up).
Customer acquisition cost (CAC) via content compares what it costs to acquire a customer through organic content versus paid channels. If your paid CAC is $800 and your content-sourced CAC is $200, that differential is a compelling ROI argument on its own.
Tier 2: Leading Indicators
These metrics don't appear on revenue reports, but they predict future revenue performance. Track them to understand whether your content engine is building momentum.
Organic traffic growth should be measured as a trend, not a snapshot. A 15% month-over-month increase in organic sessions is far more meaningful than the absolute number of visits. The organic traffic growth guide covers the specific levers that compound this trend over time.
Keyword rankings for commercial and transactional terms show whether your content is capturing demand at the bottom of the funnel, where purchase intent is highest. A solid content gap analysis will surface the terms your competitors rank for that you don't yet target.
Time on page and scroll depth indicate whether visitors actually read what you wrote. A post with 2,000 average words and a 40% scroll depth is performing. One with 45-second average time on page is not, regardless of traffic volume.
Tier 3: Vanity Metrics to Watch Carefully
Page views, social shares, and follower counts aren't useless, but they shouldn't anchor your ROI conversation. These metrics are easy to generate without generating revenue. Use them as context, not as primary evidence of content's value.
A Simple Framework for Measuring Content ROI
Step 1: Define Your Attribution Model Before You Measure Anything
Decide upfront whether you're using first-touch, last-touch, or multi-touch attribution. Each tells a different story. First-touch attribution favors content that creates awareness (blog posts, guides). Last-touch favors demo pages and sales enablement assets. Multi-touch is the most accurate but requires CRM configuration.
For most small and mid-sized marketing teams, a linear multi-touch model (credit distributed equally across all touchpoints) is a reasonable starting point that doesn't require enterprise tooling.
Step 2: Tag Everything with UTM Parameters
Every piece of content you distribute should have a UTM source, medium, and campaign tag attached to every outbound link. This is non-negotiable. Without UTMs, you cannot connect content consumption to conversions in your analytics platform.
Tools like Google Campaign URL Builder make this fast. Build a UTM naming convention and enforce it across your team. Document your process in a content brief template so every piece is properly tagged before it goes live.
Step 3: Set a Baseline, Then Measure Change
Pick a 90-day baseline period before any new content initiative begins. Record your organic traffic, MQL volume, organic CAC, and any pipeline attribution you can pull. Then measure those same numbers every 90 days going forward.
Percentage change is far easier to communicate to stakeholders than absolute numbers, especially early in a content program when absolute numbers are small.
Step 4: Calculate Organic Traffic Value as a Proxy
If you don't yet have reliable revenue attribution, use organic traffic value as a tangible proxy that resonates with budget-holders. The formula:
Organic Traffic Value = Monthly Organic Clicks x Average CPC for Your Target Keywords
If your content drives 5,000 organic clicks per month and the average CPC for those keywords is $4.50, your content is delivering $22,500/month in traffic value you didn't pay for in ads. Over 12 months, that's $270,000 in avoided paid spend. Present that number alongside your content production costs and the ROI conversation changes immediately.
Step 5: Report on Content Decay
Content decay is the rate at which a piece's organic performance drops over time without updates. Tracking which posts are declining tells you where to invest in refreshes rather than net-new production. A refreshed post typically recovers rankings in 60-90 days and costs a fraction of a new post.
This is especially relevant as you scale content production: knowing which existing posts need attention prevents the mistake of endlessly adding new content while your best performers quietly lose ground.
Benchmarks to Know
- B2B content marketing average ROI: 702% over three years, according to industry research
- Strong content ROI threshold: 5:1 or 500%
- Content-influenced pipeline: Healthy B2B content programs attribute 30-50% of pipeline to content influence
- Organic CAC vs. paid CAC: Content-sourced CAC is typically 3-5x lower than paid after an 18-month content investment
- Time to meaningful organic ROI: Most content programs show measurable ROI at 9-12 months; compounding returns accelerate significantly in years 2 and 3
These benchmarks are especially relevant for SaaS and tech companies. If you're working through a broader content strategy for a software business, the specifics of content marketing for SaaS companies are worth reviewing alongside this measurement framework.
Presenting Content ROI to Stakeholders
The framing of your report matters as much as the numbers in it. Avoid reporting metrics in isolation. Instead, structure every stakeholder update around this pattern:
Input (what you invested) + Output (what changed) + Business impact (what it means for revenue or pipeline)
For example: "We published 8 posts this quarter targeting mid-funnel comparison keywords. Organic traffic to those pages increased 44%. Those pages generated 62 MQLs, of which 11 converted to opportunities worth $183,000 in pipeline."
That sentence tells a budget holder everything they need to justify continued investment. Traffic up, leads up, pipeline tied to a dollar figure. The Content Marketing Institute and Sprout Social both publish annual benchmarks that can help you contextualize your numbers against industry norms when making that case.
Never present content ROI in a vacuum. Always compare it to the cost of achieving the same reach and lead volume through paid channels. That comparison almost always makes content look like the better long-term investment.
Start Small, Build the Infrastructure
You don't need a full attribution stack on day one. Start with UTM tagging, a 90-day baseline, and organic traffic value as your primary ROI proxy. Add CRM attribution as your team and tooling mature.
The teams that consistently win budget and headcount for content aren't necessarily producing the best content. They're producing content and building the measurement layer that proves its value. That combination is what transforms content from a marketing line item into a growth function.
Recommended Posts


.svg)